
Marketing Math Template
If your boss or client comes to you and tells you they want to make $10,000 this month in revenue and asked you if it was possible, what would you say? Would you just look at them and say “yeah we can do that”, then rush back to your computer in a panic just hoping you hit the revenue goal by running some ad tests and lowering your CPC? Or do you know exactly what metrics you would need to improve to get that extra $10,000? If you aren’t sure how you would go about answering this question then this marketing math template is just what you need.
In this blog post, we are going to walk you through how to answer this question the right way and how to look at the data to see what metrics you need to hit to reach your revenue goal.
Before we begin there are a few things you will need to know or have an estimate of to answer this question accurately.
- What is your average cost per click?
- What is your conversion rate?
- What Percentage of leads from your Google Ads account are qualified?
- Of those qualified leads what percentage got a sale proposal or demo?
- What percentage of people who got demos became customers?
- What is your average order value?
I know tracking down some of the answers to the question above can be difficult sometimes, but trust me it will be worth it to be able to have the data you need to achieve your revenue goal.
Once you have all of this information you can use this marketing math template to calculate what numbers you will actually need to hit in order to reach your revenue goal.
https://docs.google.com/spreadsheets/d/18OValUuV7tOIfBoEIRWK3tUdSv1yo_5NazdqwpjgksA/edit?usp=sharing
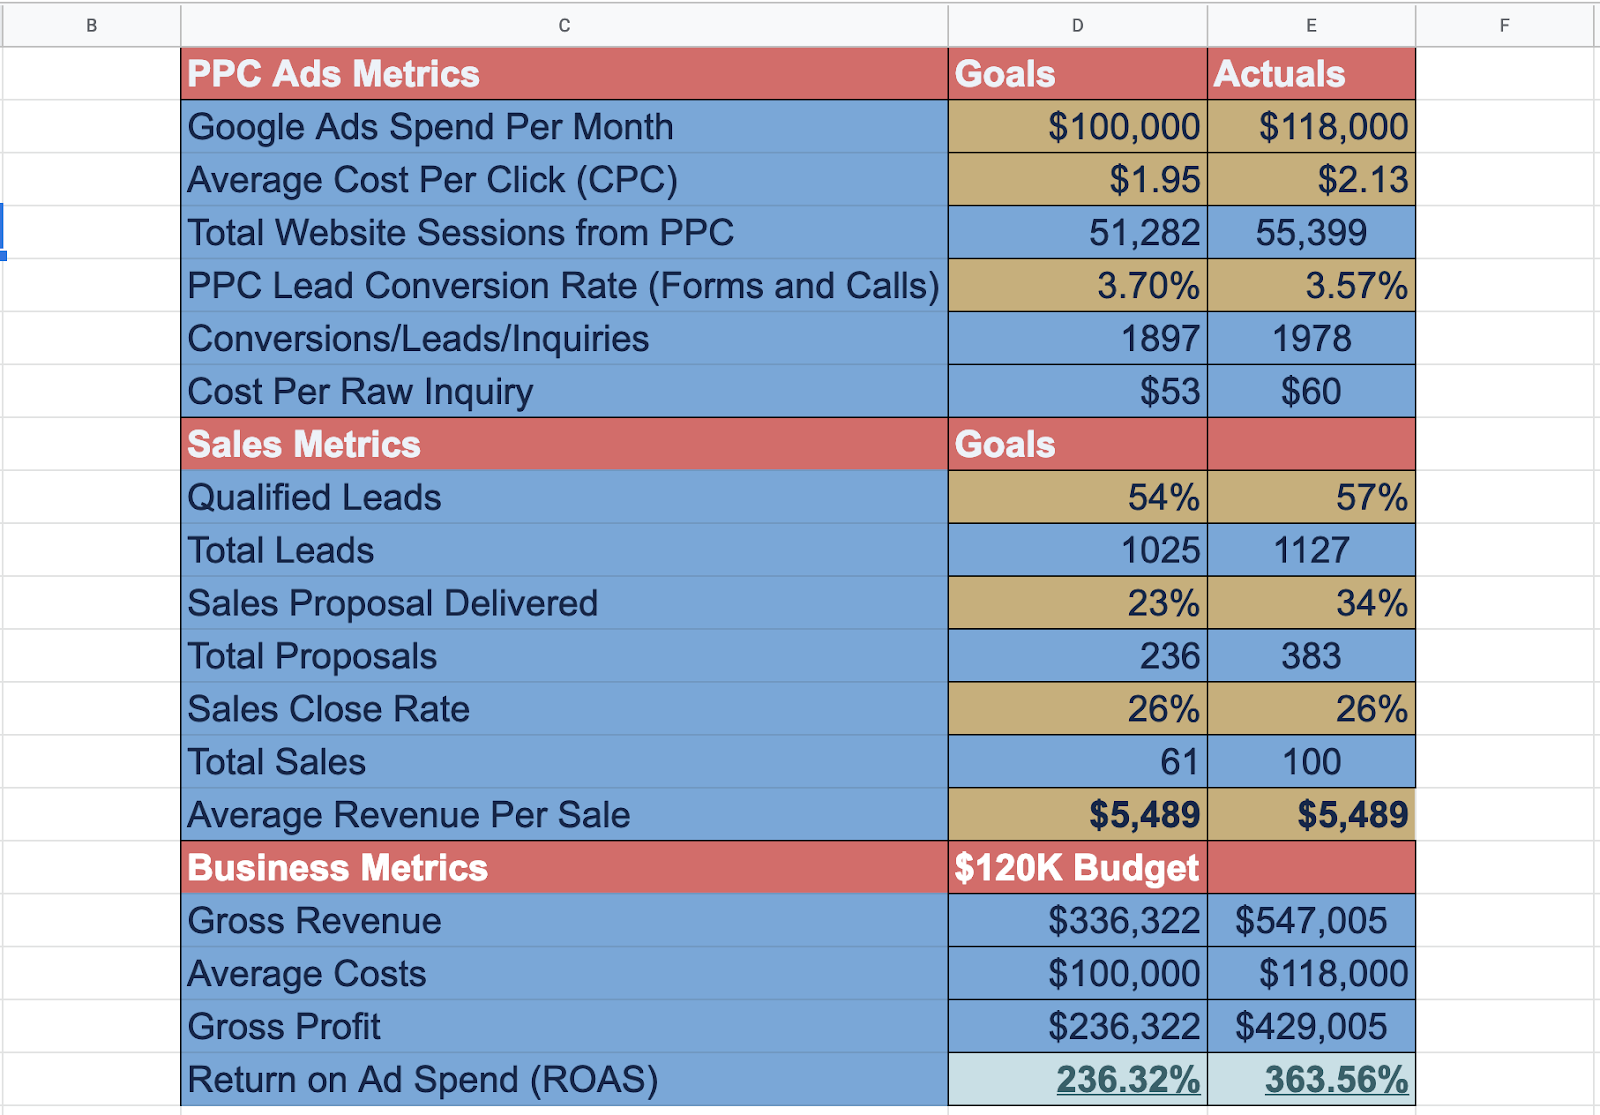
After you have the data you need, play with the numbers by lowering or raising your conversion rates and CPC to see what you can accomplish.