
Track Your Google Ads Quality Score
Quality score can be a very frustrating part of running a Google Ads account. Over the years Google has given us some insight into what goes into a quality score, but it still can be very difficult to see if the optimizations you made last month are making are really having that big of an impact on your quality score. Google does not give you a view that lets you see the history of your quality score. They recently came out with the “Quality Score (hist.)”, but this metric still does not allow you to see your quality score based on specific dates. This post will walk you through how you can keep track of your Google Ads quality score to see if your optimizations are actually helping your campaigns.
Quality Score Script
The first thing you will need to do is copy this script by Russell Savage from FreeAdWordsScripts.com. This script stores the Quality Score for any date range via Google spreadsheets. This is a fantastic script, as you can compare the scores between certain date ranges and see where you need to improve
http://www.freeadwordsscripts.com/2013/04/store-account-campaign-and-adgroup.html
Once you have your script you will then need to head over to Google Ads and click on the tools icon in the top right-hand corner. Then click on “scripts” in the drop-down, then click on the blue plus button.


Customizing The Quality Score Script
Once you click the button you will see a section to copy the script to the page. Before you save the script there are a few things you will want to customize in the code.
- Decimal place – Is the number of decimal places you would like to see. ( I kept the default of 4 places)
- Date Range – This is how often you want the script to run and collect data. For this setting, I recommend changing it to every 7 days, that way you are collecting quality score data frequently.
- SpreadSheet Name – You will need to create a new Google Sheets and name it whatever you would like, just as long as you name it the same thing in the script. I choose to name my sheet “Quality Score From Scripts”.

After you have that all updated hit the “run” button at the bottom of the screen. You can choose to preview the script before you run it, but because this script is just collecting data and putting it in a Google Sheet it will show that no changes have been made to your Google Account. Once you have run the script you will notice that your sheet now has quality score data for your account.
Before you leave Google be sure to set the frequency of your script to match whatever date range you decided to choose on the script. Because I set my script to every 7 days, I simply told Google to run my script every Monday at 10:00 am that way I can start every week looking at how my quality score is doing.

Organize Data With Pivot Table
Now that data is getting fed into your Google Sheet the next thing to do is make that data easy to read. When you first see the data it will look similar to the image below, which makes it a little hard to compare dates and see if your quality score is improving over time.

In order to make the data more useable, I like to organize it with a pivot table. If you are new to pivot tables follow these steps to turn your data into actionable insights.
First – highlight all the data.
Second – click “data” then “pivot tables”
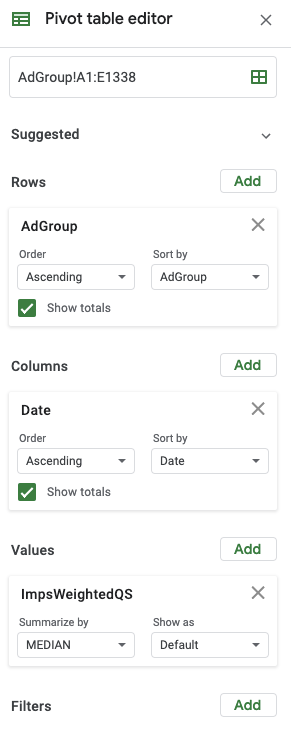
Third – Enter these settings is the corresponding fields
- Rows – AdGroup
- Columns -Date
- Values – ImpsWeightedQS (Make sure you change “summarized by” to “MEDIAN”)
Fourth – Highlight all the quality score data, click on “insert” then “conditional formatting”. I like to change the color scale to show red to green that way you can clearly see the problem areas. By the time you have completed all these steps, your sheet should look something like this.

From here you can identify the areas you need to improve and start to keep track of Google Ads quality score. 🙂